The CAC payback period is the number of months it takes for the gross profit a customer generates to repay what you spent acquiring them, calculated as CAC divided by monthly gross profit per customer. A Shopify brand with a S$180 CAC earning S$38 of gross profit per month from a subscriber recovers its money in 4.7 months. Benchmarks split hard by business model, from 1 to 3 months for marketplaces to a 15 to 16 month median for B2B SaaS. Payback matters more than most founders realise because it is the metric that decides how much cash your growth needs, not just whether that growth is profitable eventually.
This guide covers the formula, what belongs in the inputs, current benchmarks by model, the three levers that move the number, and the calculation errors that make a broken account look healthy.
The CAC payback period is the time, usually expressed in months, required for a customer's cumulative gross profit to equal the customer acquisition cost spent to win them. It answers a cash question rather than a profitability question: not "is this customer worth more than they cost", but "when do I get my money back". A brand can have a healthy 4:1 lifetime value to CAC ratio and still run out of cash if that lifetime value takes three years to arrive.
The distinction matters because the customer acquisition cost formula tells you what a customer costs, and the LTV:CAC ratio tells you whether that cost is justified, but neither tells you when the money returns. Payback is the timing metric that sits between them. Tomasz Tunguz has made the working-capital case bluntly: a longer payback period ties up several times more cash to fund the same rate of growth, because every acquisition dollar sits unrecovered for longer before it can be spent again.
The formula is CAC divided by monthly gross profit per customer. Monthly gross profit is average revenue per customer per month multiplied by gross margin percentage, so the full expression is CAC ÷ (ARPU × gross margin %). Use gross profit, never revenue, because revenue you have to spend on product and fulfilment cannot repay anything.
For a non-subscription store, convert annual behaviour into a monthly figure first:
Monthly gross profit = (AOV × gross margin % × annual order frequency) ÷ 12
Worked example, one-off purchase brand. A Singapore skincare brand has a S$180 blended CAC, a S$120 average order value, a 55 percent gross margin, and customers who order 1.6 times a year. Annual gross profit per customer is S$105.60, or S$8.80 a month. Payback is S$180 ÷ S$8.80, which is 20.5 months.
Worked example, same brand on subscription. The same S$180 CAC against a S$59 monthly subscription at a 65 percent margin produces S$38.35 of monthly gross profit. Payback is S$180 ÷ S$38.35, which is 4.7 months.
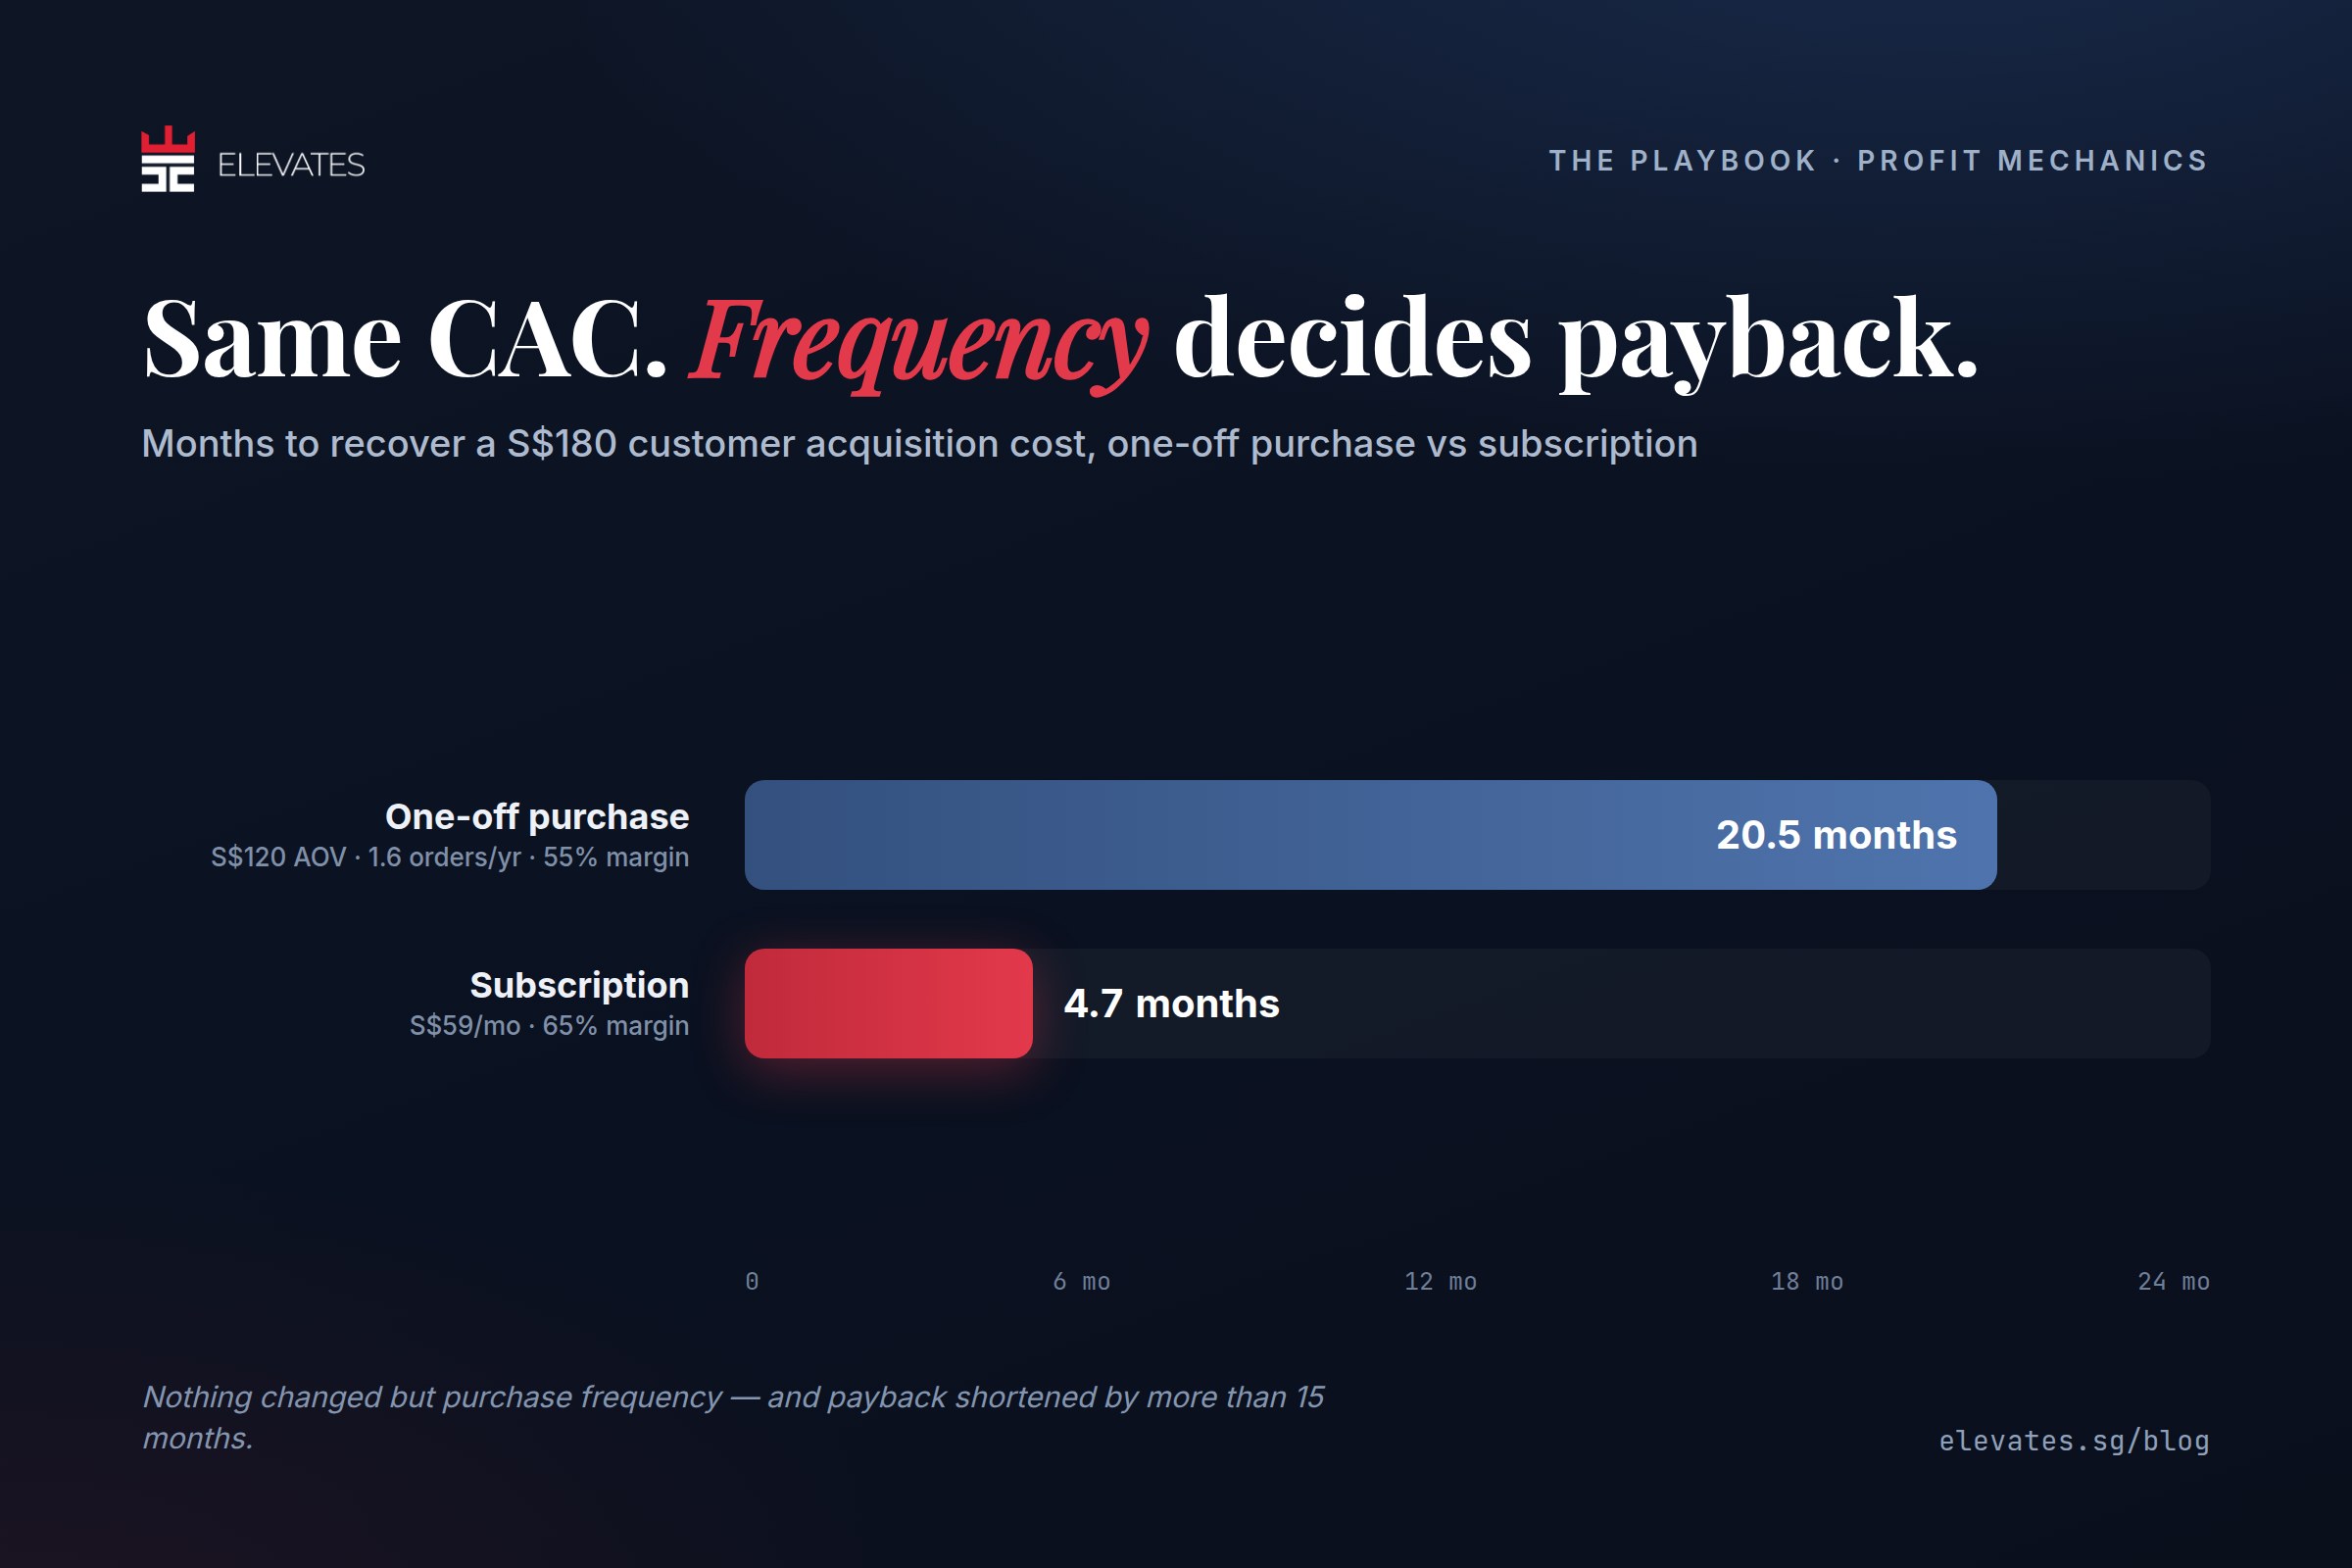
Nothing changed except purchase frequency, and the payback period shortened by more than 15 months. That is why subscription and replenishment mechanics dominate the DTC categories that scale on paid media.
Gross profit here means revenue minus the variable costs of delivering the order: cost of goods, inbound freight and duties, payment processing, pick and pack, outbound shipping, and expected returns or refunds. Exclude fixed overheads such as rent, salaries, and software, because those costs exist whether or not you acquire the customer. Most contribution margin figures we see in client accounts fall 8 to 15 percentage points below the gross margin the founder quotes, almost always because Shopify payment fees, shipping subsidies, and return rates were left out.
Include the same cost base on the CAC side that you would use anywhere else: ad spend, agency or in-house salaries, creative production, and platform fees, divided by net-new customers only. Counting returning customers in the denominator is the single fastest way to make a payback period look two or three times better than it is.
A good CAC payback period is one your cash position can survive, and the honest benchmark ranges vary by a factor of ten across business models. The table below consolidates the most commonly cited 2026 datasets. Treat these as orientation, not targets, in the same way published CAC benchmarks need reading against your own margins.
| Business model | Typical payback | Source |
|---|---|---|
| Marketplace | 1 to 3 months | Eightx 2026, from FY2025 SEC filings including Etsy and eBay |
| Subscription consumer brand | 3 to 9 months | Eightx 2026, Chewy and comparable filers |
| Pure DTC ecommerce | 6 to 12 months | Eightx 2026 |
| Self-serve or PLG SaaS, sub-US$5K ACV | 7 to 11 months | Aleph and Benchmarkit 2026 |
| B2B SaaS, all segments | 15 to 16 months median | Benchmarkit 2026, 342 companies |
| Enterprise SaaS, US$50K to US$100K ACV | 22 months median | Aleph and Benchmarkit 2026 |
Bessemer's widely used scoring bands read payback of 0 to 6 months as best in class, 6 to 12 as strong, 12 to 18 as acceptable, 18 to 24 as concerning, and beyond 24 months as critical. For DTC brands the useful floor is tighter: under 6 months is excellent, under 12 months is workable, and beyond 12 months the model needs unusually fat margins, exceptional retention, or outside capital to hold together.
One number is worth more than any of these to an ecommerce operator: whether CAC is below first-order contribution margin. If it is, every new customer is cash-positive on day one and payback is effectively immediate. If it is not, you are funding each acquisition out of working capital and betting on repeat purchase to bail you out.
Payback governs how fast you can grow without raising money, because it determines how many times a year you can recycle the same acquisition dollar. A brand recovering CAC in three months turns its acquisition budget over roughly four times a year. At 12 months it turns over once. Same margin, same LTV:CAC ratio, four times the growth capacity.
The working capital consequence is direct. A brand spending S$50,000 a month on acquisition with a five-month payback has roughly S$250,000 of unrecovered acquisition cost outstanding at steady state. Stretch payback to 15 months and the same S$50,000 monthly spend ties up around S$750,000. That half-million difference is not profit, it is cash sitting inside customers you have already bought, and it is the reason profitable-on-paper brands stall when they try to scale spend.
LTV:CAC still matters, and the 3:1 guideline that David Skok popularised remains a reasonable floor. But LTV:CAC is a verdict delivered years late. Payback is a verdict you can act on this quarter.
There are only three inputs, so there are only three levers: reduce CAC, raise gross profit per order, or increase purchase frequency. Frequency is usually the largest, because it multiplies through the whole equation rather than nudging one term.
| Lever | What actually moves it | Realistic effect |
|---|---|---|
| Lower CAC | Fixing measurement first, then creative volume and landing page conversion rate | A 20 percent CAC reduction cuts payback by 20 percent, one for one |
| Higher gross profit per order | Bundles, price testing, raising AOV, cutting shipping subsidies and return rates | Compounds with frequency, so gains stack |
| Higher purchase frequency | Subscription or replenishment offers, lifecycle email and SMS flows, post-purchase sequencing | Largest single effect, as the 20.5 to 4.7 month example above shows |
The order matters. Chasing creative performance while your Meta pixel is undercounting conversions produces a CAC figure that is wrong before you start optimising it, which is why we treat server-side tracking and the Conversions API as the first fix in almost every account, ahead of any creative or bidding work. The full sequence is covered in our guide on how to acquire a customer.
Five errors account for most of the distorted payback numbers we see in audits, and four of them flatter the result.
Fix the measurement before you act on the number. A payback period built on the wrong inputs will point you at the wrong lever, and the cost of that mistake is a quarter of misdirected spend.
Under 6 months is excellent and under 12 months is healthy for most DTC brands. Subscription and replenishment models should target 3 to 9 months. Anything past 12 months requires strong margins, high repeat rates, or external funding to sustain.
Use contribution margin, meaning revenue minus all variable costs of delivering the order, including payment fees, shipping, and expected returns. Gross margin figures that include fixed overhead allocations produce a payback number that is wrong in both directions depending on your volume.
Break-even ROAS is a single-order test that asks whether one transaction covers its own acquisition cost. CAC payback measures the same question across a customer's repeat purchases over time, so it accounts for the second, third, and fourth orders that break-even ROAS ignores.
Review it monthly by acquisition cohort, and read it on a rolling 90-day basis to smooth seasonality. Recalculate immediately after any pricing change, margin change, or shift in channel mix, because all three change the inputs.




 Book a Discovery Call →