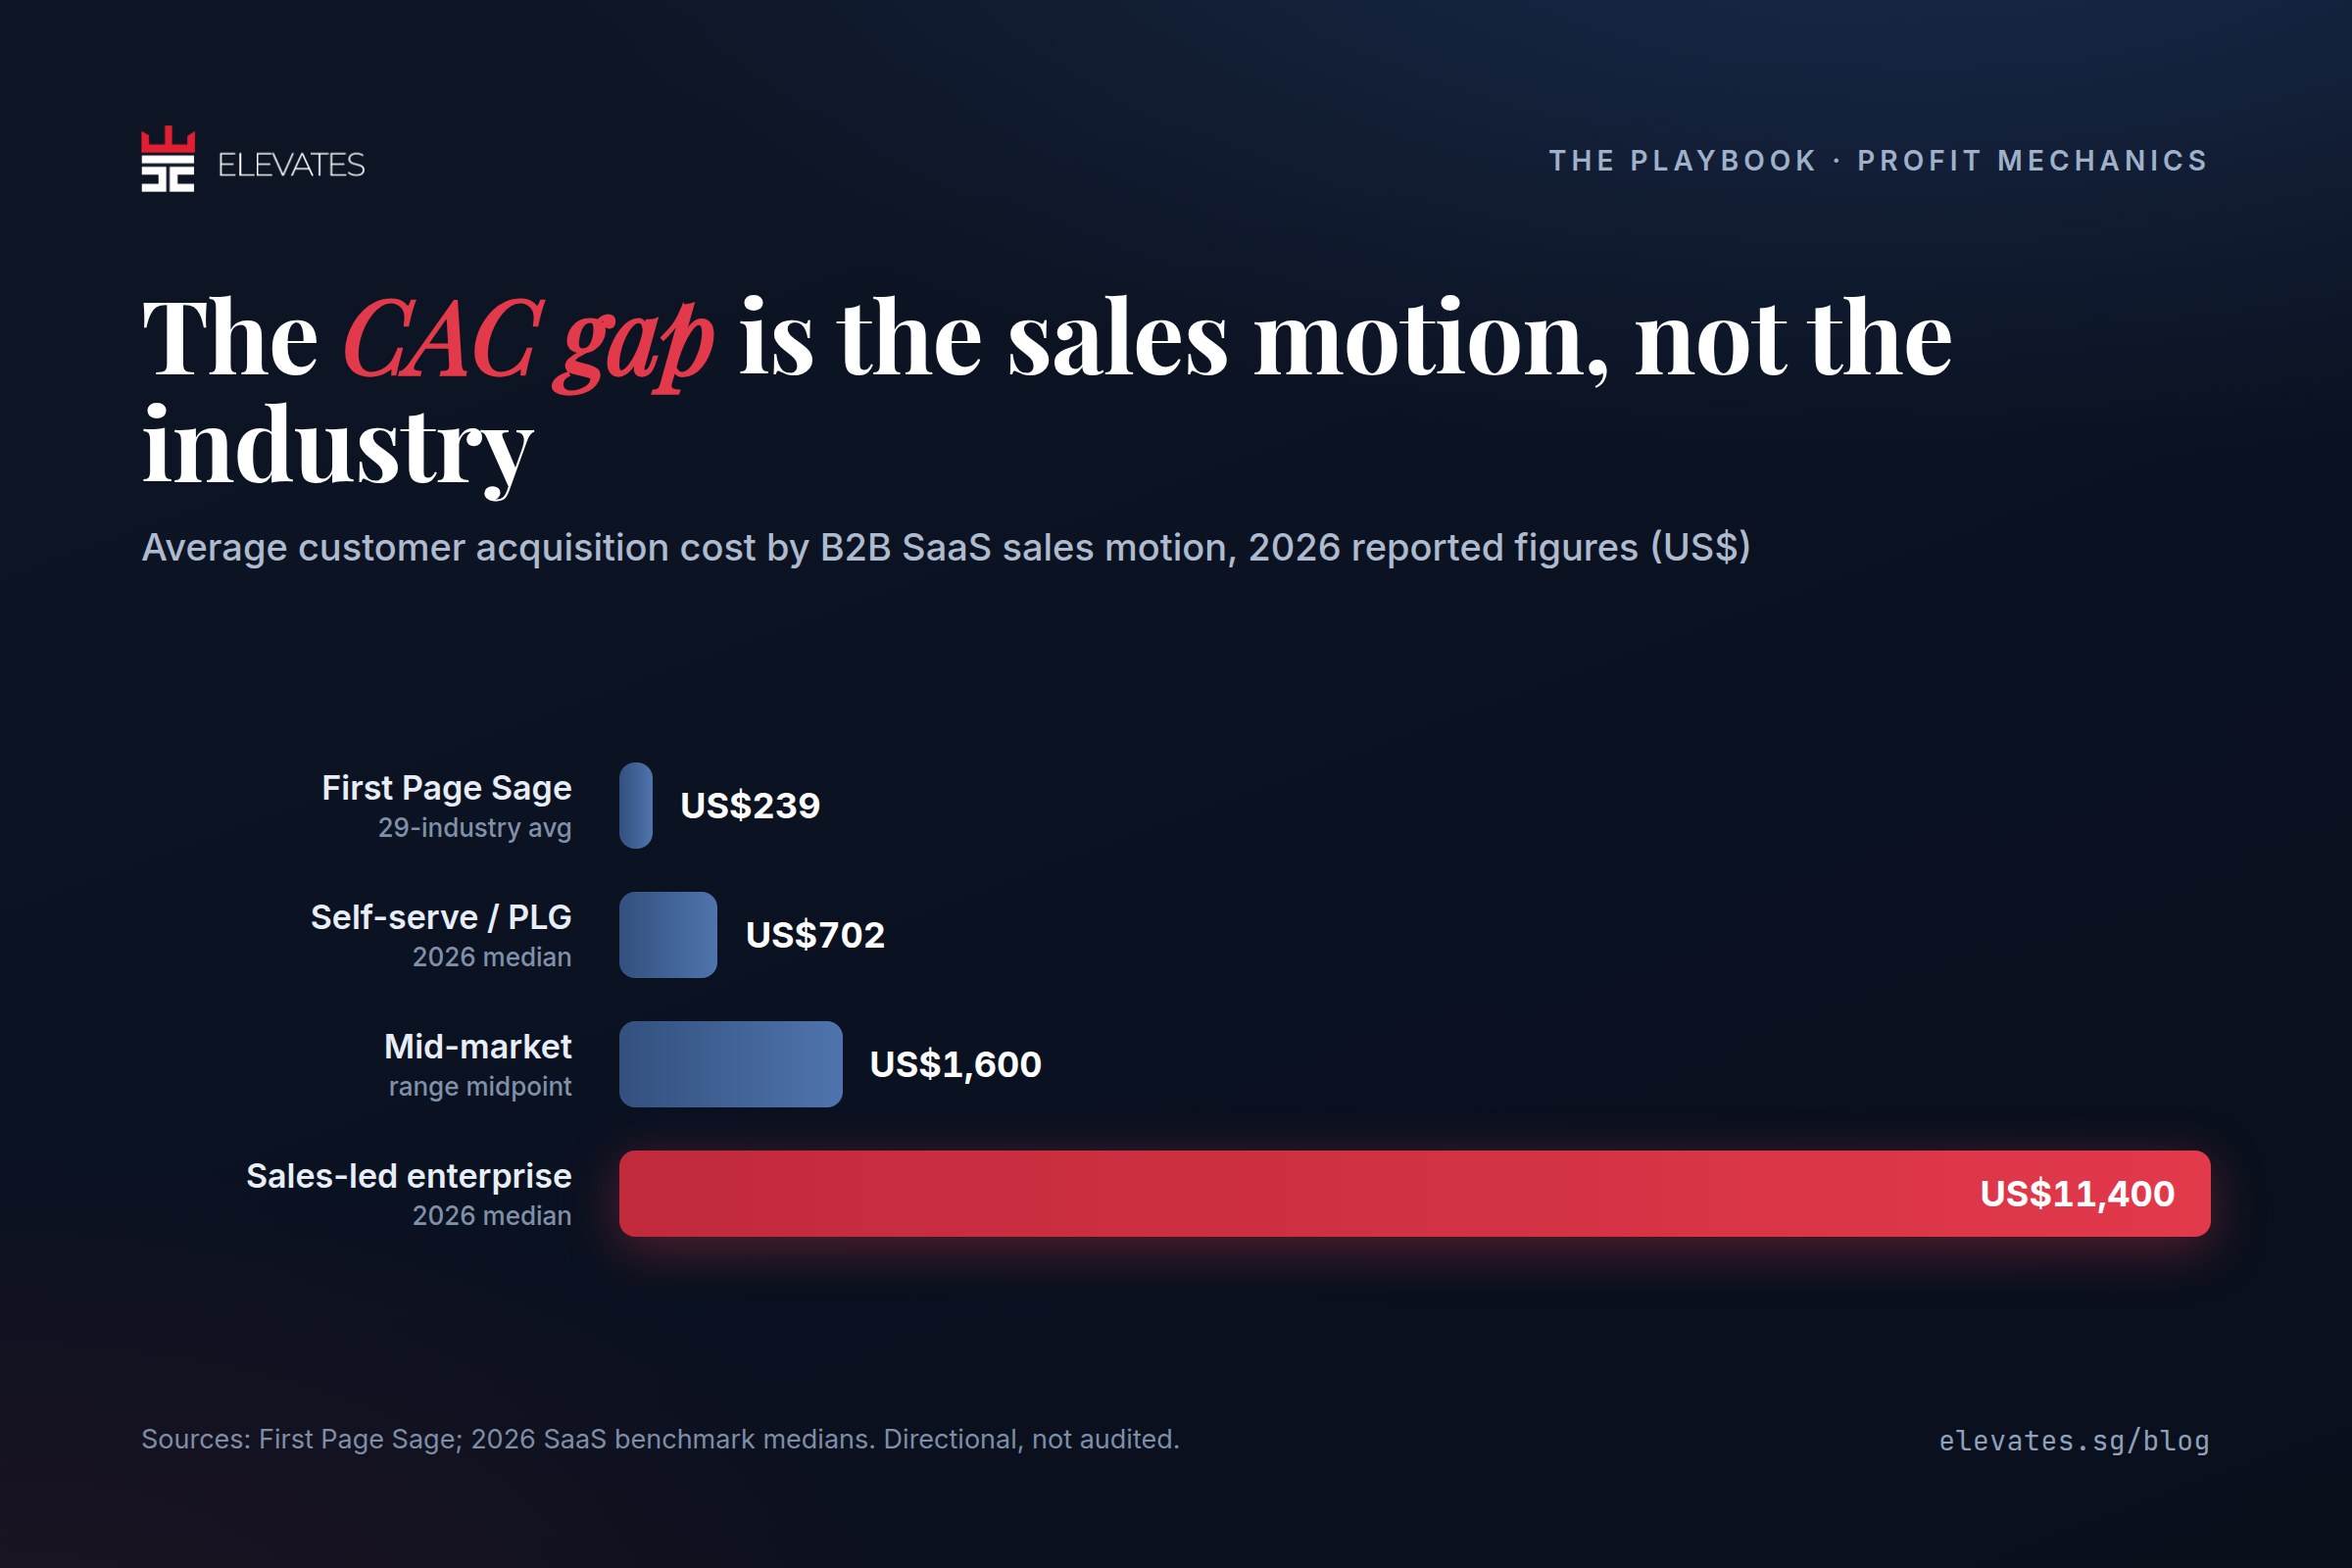
There is no single good CAC, only an acquisition cost per customer that your margins and repeat rate can carry. The published benchmarks disagree wildly: B2B SaaS averages land near US$239 in one 29-industry analysis, while other 2026 datasets report a US$702 median for self-serve SaaS and roughly US$11,400 for sales-led enterprise. For e-commerce, most sources converge on a much tighter US$68 to US$84 band. The gap between those SaaS figures is not measurement error, it is the result of different definitions, different sales motions, and different geographies being averaged together.
This guide sets out the real benchmark ranges by source, explains why they conflict, and gives you three tests that work better than any industry average.
A good CAC is one that your customer pays back fast enough to fund the next acquisition. In practice that means two thresholds, not one benchmark. Lifetime gross profit should be at least three times CAC, a guideline David Skok of Matrix Partners published in his SaaS Metrics 2.0 work around 2010 and framed as a minimum floor rather than a target. Payback should land inside 12 months for most subscription businesses, and inside three to four months for direct-to-consumer e-commerce, which has thinner margins and far less predictable retention.
Notice that neither test requires you to know your industry average. That is deliberate. A benchmark tells you what other companies with other margins are paying. Payback tells you whether your own business can afford what you are paying. The benchmark is one input into the wider question of how to acquire a customer profitably.
Average CAC is total sales and marketing cost for a period divided by the new customers acquired in that period. The published averages you will find almost always mix two very different versions of that number: blended CAC, which counts every new customer including organic and referral, and paid CAC, which counts only customers attributed to paid media. One 2026 benchmark analysis found paid CAC now runs roughly 2.4 to 3.1 times blended CAC across most categories. Comparing your paid CAC to someone else's blended average will make a healthy account look broken.
For the underlying formula and what belongs inside the calculation, see our guide to the customer acquisition cost formula.
The average CAC for B2B SaaS depends almost entirely on sales motion, not on vertical. Self-serve and product-led products cluster low, and enterprise sales-led products run an order of magnitude higher. Here is what the main 2026 datasets report, in US dollars.
| Source or segment | Reported average CAC |
|---|---|
| First Page Sage, 29 B2B SaaS industries | ~US$239 combined average |
| Self-serve / product-led SaaS (2026 median) | ~US$702 |
| SMB SaaS | US$200 to US$700 |
| Mid-market SaaS | US$1,200 to US$2,000 |
| Sales-led enterprise SaaS (2026 median) | ~US$11,400 |
| Fintech SaaS | ~US$1,450 |
| Insurance SaaS | ~US$1,280 |
Two structural facts sit behind the spread. Enterprise deals carry SDR and AE compensation inside CAC, which self-serve funnels do not. And B2B sales cycles have lengthened, with the average B2B SaaS cycle now reported at around 134 days, up from about 107 days in early 2022, which means more touchpoints and more cost per closed deal.
A related efficiency metric is worth more than the raw figure: the median SaaS company in 2026 spends roughly US$2.00 of sales and marketing to acquire US$1.00 of new ARR. That ratio travels better across company sizes than a dollar CAC does.
E-commerce benchmarks are far more consistent than SaaS ones. Multiple 2026 datasets, drawing on Shopify data and First Page Sage's e-commerce client analysis, place the average customer acquisition cost for ecommerce between US$68 and US$84, with a wider practical band of US$50 to US$90 depending on category and channel mix.
Category matters more than the overall average. Reported 2026 figures by vertical:
| Category | Reported average CAC |
|---|---|
| DTC pet products | ~US$23 |
| DTC fashion | ~US$37 |
| DTC beauty | ~US$42 |
| Food and beverage | US$45 to US$53 |
| Consumer electronics | US$76 to US$377 |
| Luxury | US$175 to US$200+ |
Read those alongside margin and repeat rate, or they will mislead you. Fashion at US$37 looks cheap until you account for returns and weak repurchase rates. Pet supplies at US$23 sit on top of strong subscription behaviour, so the same dollar buys far more lifetime value. Electronics is the hardest position in the table: high acquisition cost paired with low repeat purchase, which is double pressure on the same margin.
Because there is no governing definition of CAC, and every dataset makes different choices. Four differences account for most of the variance.
Mostly not at face value, because nearly every published CAC benchmark is North American and denominated in US dollars. Media costs are the largest input into CAC, and CPMs in Southeast Asia sit materially below US and UK levels. One 2026 benchmark analysis estimates Southeast Asian acquisition costs run 40 to 60 percent below North American figures, though that is a directional estimate rather than an audited dataset, so treat it as a sanity check rather than a target.
The practical implication for a Singapore brand is straightforward. If your Shopify store's CAC is S$60 and the published e-commerce average is US$75, you have not beaten the market. You are operating in a cheaper auction with a smaller addressable audience, which usually means lower CAC and a lower ceiling on scale. The number that matters is what happens to your CAC as you push spend up, not where it sits at current volume.
Use three internal tests. Each one answers a question a benchmark cannot.
Resist the instinct to cut spend first. High CAC with strong repeat purchase is a financing problem, not a marketing problem, and cutting acquisition in that situation shrinks the business. High CAC with weak repeat purchase is the real emergency.
The levers, in the order we usually work them: fix measurement first, because server-side tracking and the Conversions API feed the platform cleaner signal and typically move reported and real CAC in the same direction. Then raise conversion rate and average order value, since both reduce effective acquisition cost per customer without touching media at all. Then increase creative volume and concept diversity, because creative fatigue shows up as falling click-through rate and rising cost per click long before it shows up in a CAC report. Only then look at channel mix and budget reallocation across Meta Ads and the rest.
A good CAC for a small business is one recovered inside three to four months of gross profit, since most small businesses cannot finance a longer payback. Absolute dollar figures matter less than the payback window and whether the number holds as you spend more.
There is no meaningful all-industry average, because reported figures span roughly US$23 for DTC pet products to over US$11,000 for sales-led enterprise SaaS. Compare within your own business model and sales motion, or the comparison tells you nothing.
No. A very low CAC alongside an LTV:CAC ratio above 5:1 often signals underinvestment, meaning there is profitable demand you are not buying. The goal is the highest CAC your unit economics can profitably sustain, not the lowest number on the dashboard.
Review published benchmarks once or twice a year, since they update slowly and change little. Review your own CAC monthly, with a rolling 90-day view to smooth seasonality and longer purchase cycles.

 Book a Discovery Call →