Customer acquisition cost (CAC) is the total sales and marketing spend required to win one new paying customer, calculated by dividing total acquisition cost by the number of new customers acquired in the same period. A brand spending S$12,000 in a month to win 40 new customers has a CAC of S$300. On its own that number means nothing, because CAC is only readable against what a customer is worth over time. The 3:1 lifetime value to CAC guideline that most founders quote came from David Skok at Matrix Partners in his SaaS Metrics 2.0 work around 2010, and he wrote it as a minimum floor for mature subscription businesses, not as a universal target for every company.
This guide covers the definition, the formula, what belongs inside the calculation, and the customer acquisition metrics that give CAC its meaning.
Customer acquisition cost is the fully loaded cost of turning a stranger into a paying customer. It bundles ad spend, agency or in-house salaries, creative production, software, and sales commission, then divides that total by the customers those efforts produced. A Shopify brand running S$50,000 of Meta and Google spend that closes 250 first-time orders has a paid CAC of S$200 per customer. The metric matters because it is the only number that tells you whether growth is affordable. Revenue growth funded by a CAC above customer value is not growth, it is a cash burn with a marketing report attached. CAC is one measure inside the larger system of how to acquire a customer.
In marketing, CAC means the average cost to acquire one new customer across a defined period and a defined set of channels. The phrase is used loosely in practice, so always confirm two things before comparing numbers: which costs are inside the total, and which customers count in the denominator. Two teams in the same company routinely quote CAC figures that differ by 40 percent or more purely because one included salaries and the other did not.
CPA (cost per acquisition) usually measures the cost of a platform-reported conversion event, such as a lead form submission or an add to cart. CAC measures the cost of an actual new paying customer, confirmed in your backend. A lead generation account might report a S$45 CPA in Meta Ads Manager while the true CAC sits at S$420, because only about one in nine leads closes.
The formula is a single division: CAC = Total sales and marketing cost ÷ Number of new customers acquired
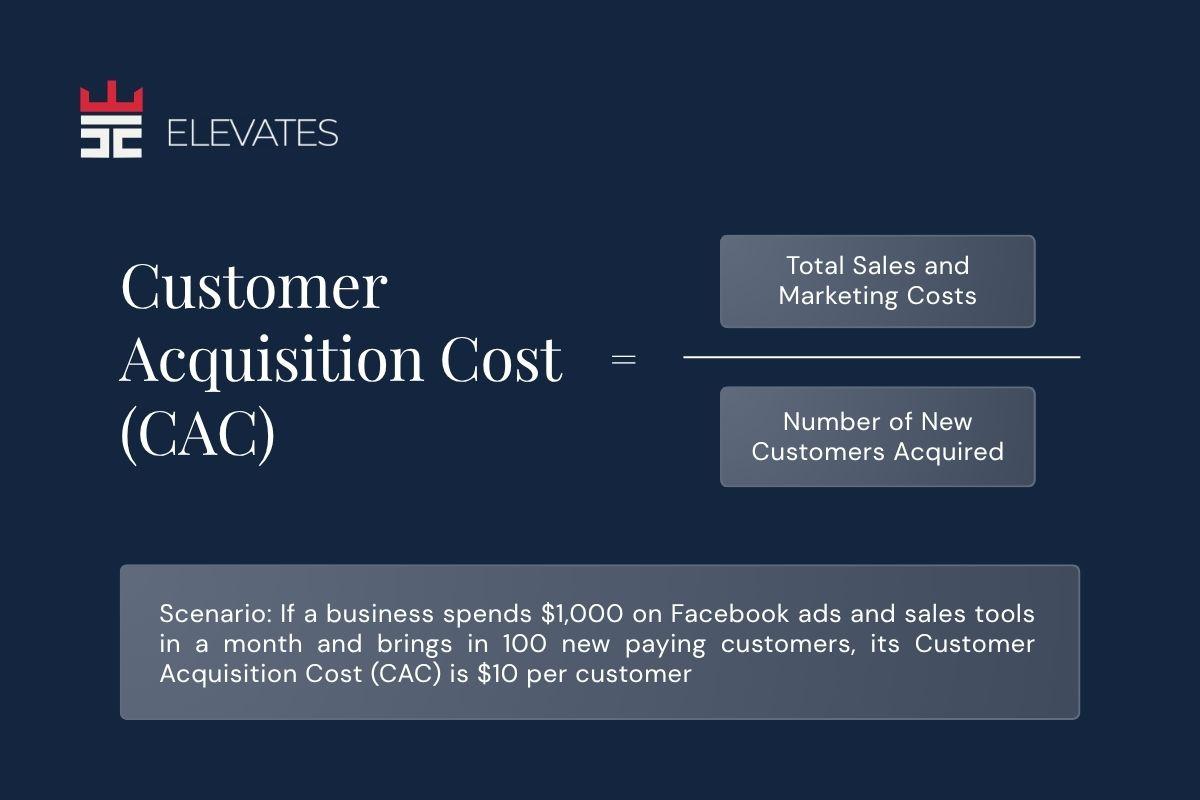 Both inputs must cover the same time window and the same set of channels. Here is a worked example for a Singapore e-commerce brand over one calendar month:
| Input | Amount |
|---|---|
| Meta Ads spend | S$28,000 |
| Google Ads spend | S$11,000 |
| Agency retainer | S$4,500 |
| Creative production | S$3,200 |
| Email and SMS platform | S$800 |
| Landing page and tracking tools | S$500 |
| Total acquisition cost | S$48,000 |
| New customers acquired | 240 |
| CAC | S$200 |
If that brand's average first order value is S$95 at a 60 percent gross margin, it earns S$57 of gross profit on the first order against a S$200 CAC. The business only works if the customer comes back. That is why CAC is never analysed alone.
Include every cost that exists to win new customers, and exclude every cost that exists to serve or retain the ones you already have. The split is not always obvious, so agree it once and hold it constant so month-to-month numbers stay comparable.
| Include | Exclude |
|---|---|
| Paid media spend across all channels | Customer support and fulfilment costs |
| Agency fees and media management retainers | Product development and R&D |
| Marketing and sales salaries plus commission | Retention email flows sent to existing buyers |
| Creative production, UGC, and photography | Shipping, packaging, and payment processing |
| Landing page, CRO, and tracking tooling | Office rent and general overheads |
| Affiliate payouts and influencer fees | Loyalty programme rewards |
The single most common distortion is leaving out labour. An in-house team of two marketers on S$5,000 a month each adds S$10,000 to the numerator, which on 240 new customers moves CAC from S$200 to S$242. That is a 21 percent understatement if you ignore it.
Report both, because they answer different questions. Blended CAC divides total acquisition cost by every new customer, including those who arrived through organic search, referral, or direct traffic. Paid CAC divides paid media cost by only the customers attributed to paid channels. Blended CAC tells you whether the business is healthy. Paid CAC tells you whether the ad account is working. Blended CAC is the more honest business number because it cannot be inflated by attribution generosity. Paid CAC is the more actionable media number because it responds to budget and creative decisions within days. A brand with a strong organic base will always show a blended CAC well below its paid CAC, and that gap is worth tracking as its own metric.
There is no absolute good CAC, only a CAC that is correctly proportioned to customer lifetime value and to how fast you get your money back. Two tests do most of the work. For the published averages by industry, and why they mislead, see what counts as a good CAC. The LTV to CAC ratio. Divide customer lifetime gross profit by CAC. The 3:1 convention traces to David Skok's SaaS Metrics 2.0 framework, drawn from mature public SaaS companies with stable churn. It was written as a floor rather than a goal, and it maps poorly onto direct-to-consumer e-commerce, where gross margins are thinner and repeat behaviour is far less predictable beyond 12 months. For a DTC brand, calculate the ratio on 12-month contribution margin rather than lifetime revenue, or the number will flatter you badly. The CAC payback period. This is how many months of gross profit it takes to recover CAC. It needs no churn assumption, which makes it more defensible than LTV when your cohort data is thin. A brand with a S$200 CAC earning S$57 of gross profit per order from a customer who buys every 10 weeks recovers its CAC around month nine.
CAC is a summary number, so when it moves you need the metrics underneath it to explain why. These are the customer acquisition metrics worth reporting alongside it every month.
| Metric | What it tells you |
|---|---|
| CPM (cost per 1,000 impressions) | Auction pressure and audience competition |
| CTR (click-through rate) | Whether the creative and hook are earning attention |
| CPC (cost per click) | The combined effect of CPM and CTR |
| Conversion rate | Whether the landing page and offer close the traffic |
| AOV (average order value) | How much revenue each acquisition produces upfront |
| MER (marketing efficiency ratio) | Total revenue divided by total ad spend, a blended sanity check |
| Repeat purchase rate | Whether acquired customers are worth more than their first order |
| CAC payback period | How long the business waits to recover acquisition cost |
Read them as a chain. A CAC that rose 30 percent is almost always traceable to one link: CPM inflation, creative fatigue showing up as falling CTR, or a conversion rate drop caused by a page or offer change.
CAC rises for structural reasons, not because a media buyer got worse. Auction density increases as competitors enter the same audience, so CPMs climb. Creative fatigues, so CTR falls and CPC rises even when CPM is flat. Signal loss from iOS privacy changes and consent frameworks degrades conversion attribution, so platforms optimise on thinner data and reported CAC drifts away from real CAC. The durable fixes are on the same three levers. Feed the platform better data through server-side tracking and the Conversions API so optimisation improves. Increase creative volume and genuine concept diversity rather than resizing the same idea. Lift conversion rate and AOV so the same CAC buys more contribution margin.
Divide total sales and marketing cost for a period by the number of new customers acquired in that same period. If you spent S$48,000 and acquired 240 new customers, CAC is S$200. Keep the cost definition and the customer definition constant across months so the trend stays readable.
Yes, a fully loaded CAC includes the salaries and commissions of everyone working on acquisition, along with agency fees. Many teams report a media-only CAC for daily optimisation and a fully loaded CAC for board reporting. Label which one you are showing.
CAC is what you pay to win a customer. Customer lifetime value is the gross profit that customer generates across their whole relationship with you. CAC is a cost you incur once and know precisely; LTV is a forecast you refine over time.
Monthly is right for most businesses, with a rolling 90-day view alongside it to smooth out seasonality and long purchase cycles. Weekly CAC is usually too noisy to act on unless you are spending heavily every day.

 Book a Discovery Call →